Energy Efficiency in Data Centres
PUE, Cooling and What Regulators May Ask Next
Reading Time
5 min
Article Sections
6
Share Links
3
On This Page
Article Section
Introduction
Power Usage Effectiveness (PUE) is total facility energy divided by IT equipment energy, so 1.0 would mean no overhead. A low PUE alone does not make a data centre sustainable, because it ignores water, carbon, renewable share and how well the IT load is used.
AI hardware is packing more power into each rack, which strains cooling and raises electricity demand. That makes efficiency data more important to regulators, investors and customers, and it makes the limits of a single number more important too.
This article explains what PUE measures, where it falls short, which other metrics complete the picture, and what regulators may ask for next.
Article Section
What PUE Measures?
PUE compares two readings: the total energy a facility uses and the energy used by its IT equipment, meaning servers, storage and networking. As a formula, PUE equals total facility energy divided by IT equipment energy. The closer the result is to 1.0, the less energy goes to everything else.
Here is an illustrative example, not a benchmark. If a facility uses 1,500 kWh in total and its IT equipment uses 1,000 kWh, its PUE is 1.5. The extra 500 kWh is overhead, mostly cooling and power conversion, with some lighting.
Data centre infrastructure efficiency (DCiE) is the same information turned upside down. It divides IT energy by total energy and shows the result as a percentage, so a PUE of 1.5 equals a DCiE of about 67%. These metrics are defined in the ISO/IEC 30134 series, and the Bureau of Indian Standards (BIS) has adopted PUE as an Indian standard.
Article Section
Why Data Centre Energy Efficiency Needs More Than PUE?
Context decides what a PUE number means
Two PUE figures are only comparable if they share a boundary, meaning what is counted inside the measurement, along with a season, a load level and a measurement period. A figure taken on a cool day at full load can look better than the annual average. Always ask for the context behind the number.
Cooling and IT load
Better cooling lowers overhead, but efficient chips and high server utilisation reduce the IT load itself. PUE can even improve when IT load rises, because fixed overhead is spread over more IT energy, while total electricity use grows. A good PUE does not mean low energy use.
Water, carbon and renewable share
Water Usage Effectiveness (WUE) shows litres of water used per kilowatt-hour of IT energy. Carbon Usage Effectiveness (CUE) links emissions to IT energy, and the Renewable Energy Factor (REF) shows the share of energy that comes from renewable sources. Together they answer questions PUE cannot.
Utilisation and peak demand
Idle servers still draw power, so utilisation shows how much of the IT capacity is doing useful work. Peak demand, the highest load at one moment, drives grid connection needs and backup planning.
AI density
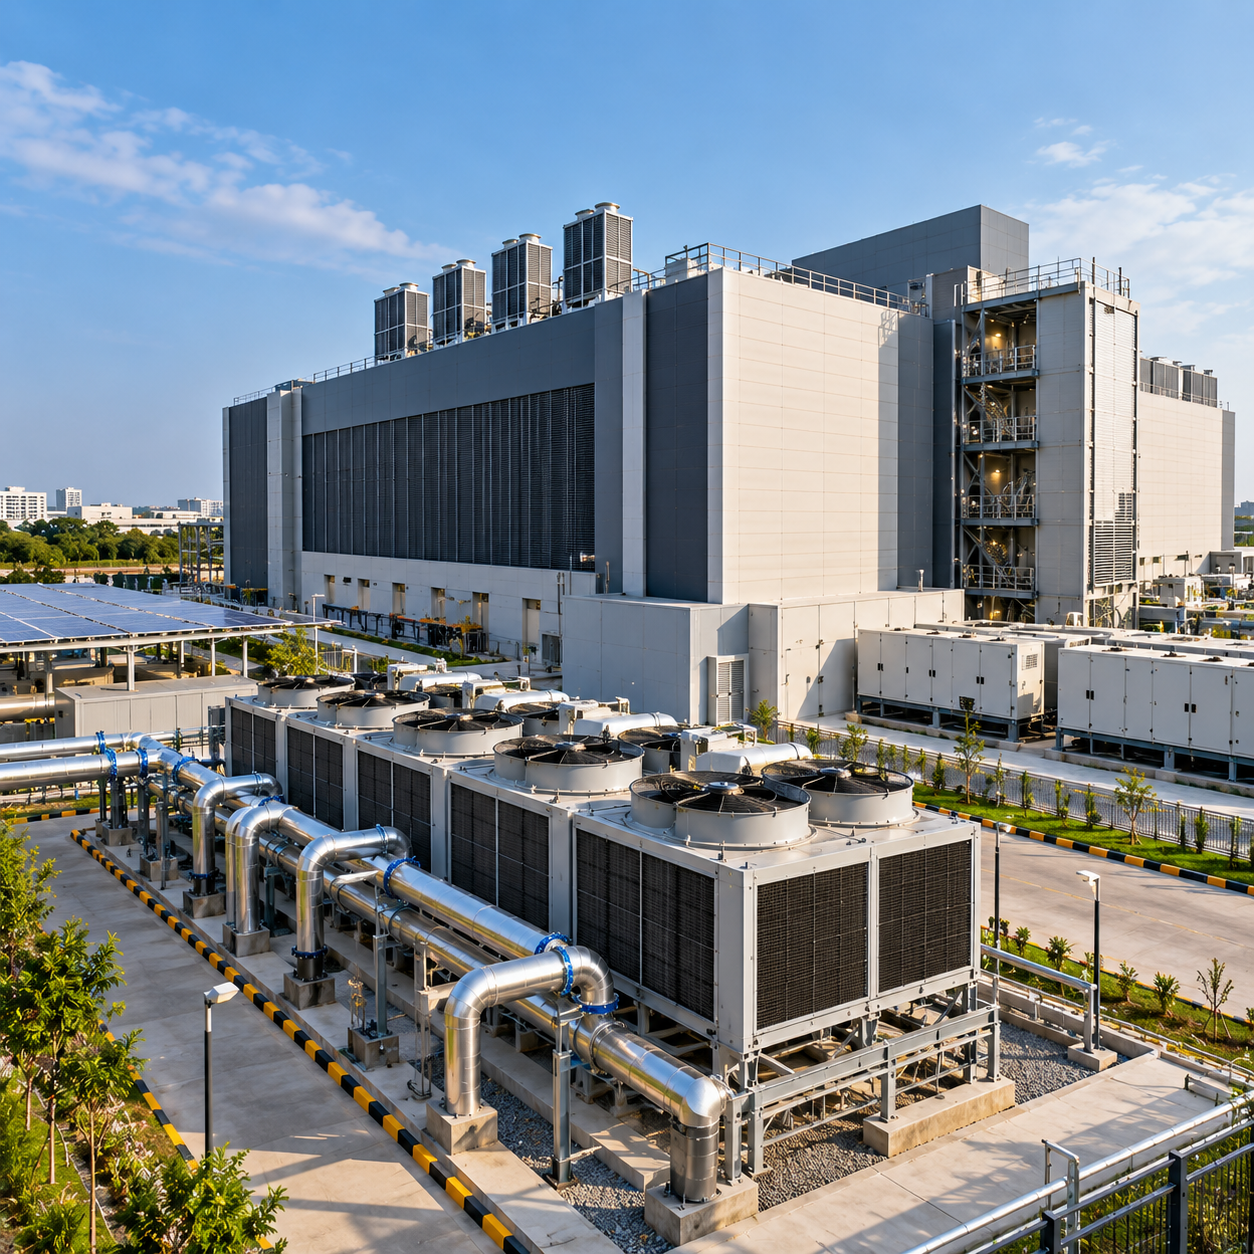
Dense AI racks produce more heat per rack, which pushes operators towards liquid cooling and tighter measurement of cooling energy. Cooling choices should be judged against PUE, WUE and total energy together.
Article Section
How to Improve and What Regulators May Ask Next?
Practical levers
Common steps include better airflow management, running at higher temperatures within equipment limits, efficient power conversion, consolidating underused servers and tuning cooling controls. In India, star labelling for chillers and cooling towers became mandatory from 1 January 2026, a useful reference when selecting equipment.
Evidence to expect
Reviewers can reasonably ask for PUE with its boundary and period, WUE, CUE, renewable share, utilisation and peak demand, backed by metering rather than estimates.
Where India stands?
India does not yet have a notified national data centre policy, and a draft from MeitY has been under consultation since August 2025. The BIS standards for PUE and related metrics are voluntary unless the government makes them mandatory, and some states, such as Rajasthan, have set their own data centre conditions.
Where disclosure is heading?
The European Union already requires larger data centres to report metrics including PUE and WUE under its revised Energy Efficiency Directive. It shows what regulators elsewhere consider material.
Article Section
Conclusion
PUE is a useful starting point, not a verdict on sustainability. It shows overhead energy but leaves water, carbon, renewable share and utilisation unanswered.
As AI density grows, operators that report PUE with its context, alongside the wider metrics, will be best placed for investor and regulator questions.
Article Section
Frequently Asked Questions
What is PUE in a data centre, and how does it differ from DCiE?
PUE is total facility energy divided by IT equipment energy, while DCiE is the same figure inverted and shown as the percentage of energy used by IT.
What is a good PUE for an AI data centre?
No single figure fits every site, because climate, load and measurement boundary change the result, so compare like with like and ask for the context.
Does a lower PUE always mean a greener data centre?
No, because PUE ignores water, carbon, renewable share and total energy use, which can rise even as PUE falls.
How can data centres improve energy efficiency?
By improving cooling and airflow, raising operating temperatures within limits, using efficient power conversion and consolidating underused servers.
What energy data should regulators ask data centres to disclose?
PUE with its boundary and period, WUE, CUE, renewable share, utilisation and peak demand, supported by metered data.
Keep Reading
Related Blogs


Next Step
Ready to turn ESG complexity into strategic advantage?
Talk to ESG Astraa about disclosures, climate strategy, governance controls, and execution support for your team.